We use carbon isotopic data for exactly the same reason that we use oxygen isotopic data: to find out from where the atoms in a specific object (e.g., an animal or plant) are derived, and what their history has been. The history of carbon atoms in living organisms involves how the organisms obtained these carbon atoms. For plants, this means how their photosynthetic reactions worked, for animals what they have been eating. Carbon isotopic records in carbonates (limestones, fossils) are of interest to paleoceanographers because they help understand the functioning of the carbon cycle during earth history, and through the carbon cycle, the history of the biosphere.
As explained in the write up on oxygen isotopes, a CO2 molecule can have different molecular weights (the parameter measured in a mass-spectrometer) as a result of the presence of one of the three stable isotopes of oxygen and one of the two of carbon isotopes. The most common configurations of CO2 are: 12C16O16O with a molecular weight of 44, by far the most common molecule; 13C16O16O, with a molecular weight of 45, and 12C18O16O with a molecular weight of 46. Molecules in which two rare isotopes are present are extremely rare, because the probability of pairing (for instance) two 18O-atoms in one CO2 molecule by randomly moving atoms is infinitesimally small. Carbon isotope data from carbonates are usually referred to the PDB standard (a belemnite, Belemnitella americana, from the Late Cretaceous PeeDee Formation in South Carolina), as are oxygen isotope data from carbonates.
Where can atoms of carbon be on Earth? In the
atmosphere,
most carbon atoms occur in carbon dioxide
(CO2).
Dissolved in the
oceans,
most carbon occurs in bicarbonate
(HCO3-).
In the
biosphere,
carbon occurs in organic matter. But in the
sediments
of the (lithosphere), the two major sedimentary reservoirs of carbon
are organic
material (including living organisms as
well as organic material in soils and fossil fuels)
and calcium
carbonate (limestones).
Isotope fractionation works differently in these two reservoirs.
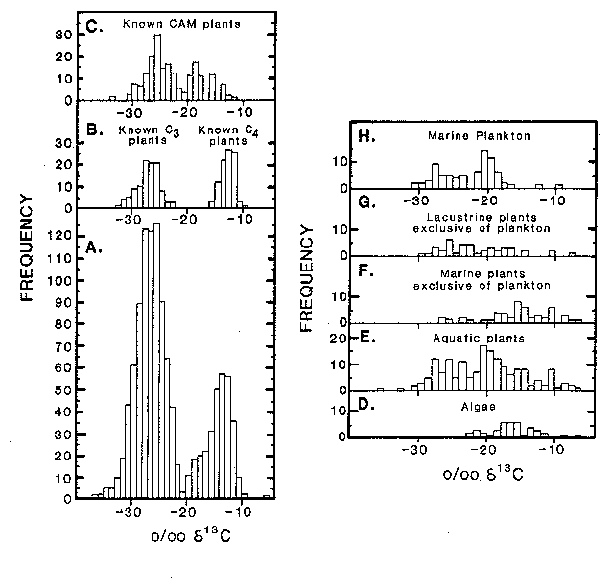
Plants use various ways of doing photosynthesis. Most plants are the so-called C3 plants, which are called C3 plants because they first organic carbon compound made in photosynthesis contains 3 carbon atoms. The carbon isotopic fractionation of such C3 plants is very large, so that plant material from such plants (including rice, wheat, soybeans and potatoes) has d13C values between -23 and -33‰, with an average of about -26‰. The carbon isotopic composition of CO2 in the atmosphere, which is what the plants use in photosynthesis, is about -6 to -7‰. By far the most plants in the world are C3 plants. C3 plants must keep the openings in their leaves through which they take up CO2 (stomata) wide open during photosynthesis, which means that they lose water through these openings.
Plants that live in dry regions (for which water loss is a problem) or in salty water (where loss of fresh water is a problem) have adapted by using a different pathway during the photosynthetic reaction, which allows them to open the stomata sparingly).This pathway is called the C4 reaction (yes, the first organic compound formed has 4 C atoms). C4 plants also do better at higher temperatures than C3 plants. Plants using the C4 reaction pathway include most tropical grasses and salt marsh grasses. C4 plants are known only since the Cenozoic and have been common only since the later part of the Miocene (about 11 million years ago). C4 plants show less isotopic fractionation of carbon than C3 plants, and have d13C values with an average about minus 13‰, ranging from minus 9 to minus 16‰. Corn is one of the few important crop plants that is a C4 plant.
Many cactuses and succulents are neither C3 nor C4 plants, but are called CAM plants, and can use either the C3 or the C4 reaction pathway. The photosynthetic reaction pathways of marine phytoplankton are not well known, but the organic matter in marine phytoplankton shows a range of values between minus 10 and minus 31‰, with most values between minus 17 and minus 22‰.
Figure 1. Carbon isotopic ratios of various
plants.
At higher concentrations of CO2 in the atmosphere and larger water supplies C3 plants generally out-compete C4 plants. We can thus predict that an increase in CO2 concentrations in the atmosphere as a result of fossil fuel burning will tend to increase the crops of wheat, decrease those of corn (everything else being equal...). It has been speculated that C4 plants evolved as a reaction to decreasing levels of carbon dioxide in the atmosphere during the later part of the Miocene.
These carbon isotopic values propagate through
the food chain. Every time that an organism eats food, there is
additional isotopic fractionation. BUT there is a fixed offset
between the d13C
values of the food and the d13C
value of specific tissues of the organism that eats the food. For
modern large mammals (i.e., larger than about mouse-sized), enamel on
teeth has a d13C
value 14.3 ‰ heavier than the food they eat. Collagen in bones
is about 6‰ heavier.
Figure 2. Isotopic composition of C3 (a) and C4 (b) plants, as well as the isotopic composition of the enamel of teeth of animals which eat such plants.

People who eat dominantly corn products (or beef, which is fed on corn) have an isotopic signature characteristic of that of mammals eating C4 plants. People who eat dominantly rice or wheat have an isotopic signature of C3 plants. Such isotopic methods have been used in order to investigate whether African elephants are dominantly browsers (eat C3 leaves which are isotopically very light) or grazers (eat tropical grasses with a heavier isotopic composition). The isotopic effect is also transferred to bones and teeth, although here we see a reflection of the carbon isotopic values of the food that the organism was eating at the time of bone and teeth growth.
An example from archeology: Vikings settled in southern Greenland during the time of Viking exploration around 900 to 1000 AD (Eric the Red), which was a warm climate period, called the Mediaeval Climate Optimum. These villages kept in contact with their families in Iceland and Norway, and send tithe money to the churches. But in the 14th century climate cooled during the beginning of the cool period known as the Little Ice Age. The colonies on Greenland lost touch with their relations in Iceland and Greenland, and they died out because they could no longer live on the agricultural products that they were used to. They could no longer leave because the waters were too ice-infested.
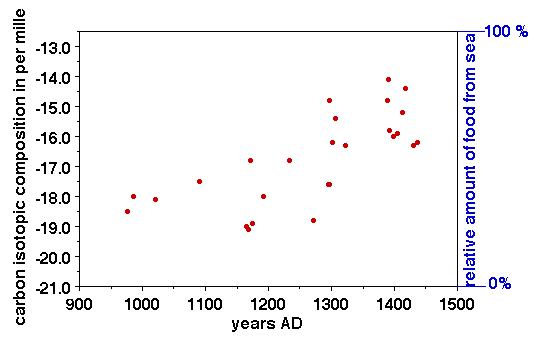
Archeologists who looked for clues about the diet of these Vikings settlers studied the villages and their burial grounds. The Inuit people in the same regions had survived the cooling climate and found things to eat, why not the Vikings? Carbon isotope studies of bone material from the burial grounds indicated that the Viking settlers started out by feeding dominantly on C3 type plants (for instance, wheat). Collagen in bone in humans is about 6 ‰ heavier than the carbon isotopic value in their food, so eating of C3 plants with an average isotopic value of minus 26 ‰ results in collagen with an average isotopic composition of minus 20‰.
The clothes in which the bodies were wrapped were dated using 14C, radioactive carbon. Over time, as climate cooled, the Viking's bones showed signs of becoming isotopically heavier. They could not have switched to C4 plants, because such plants do not thrive in cold weather, and the Vikings did not have corn (C4). Comparison studies with tissue samples of Recent Inuit shows in the area shows that live on seal meat results (in this region) in a carbon isotopic composition of about 12.5 ‰. The Vikings did switch to a diet with more ocean-derived food (fish, seals), but apparently did not switch completely to a diet similar to that of the Inuit in the region and they became extinct.
Figure 3. Carbon isotopic values in collagen in bones of people buried in the Viking villages in western Greenland, plotted versus age of the bones. (Radiocarbon, 1999).

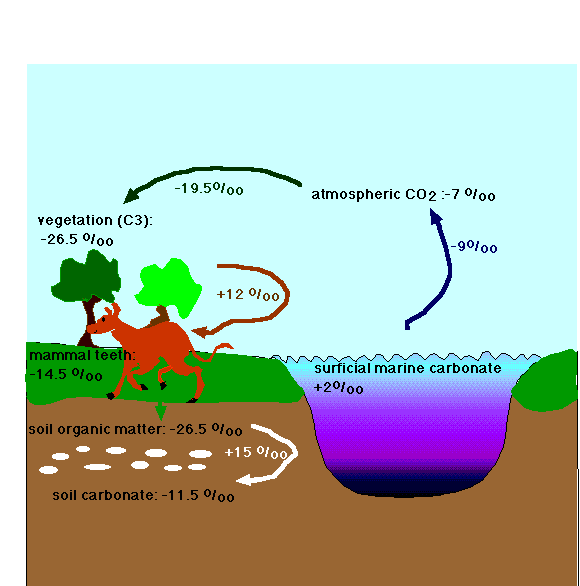
Note the as a result of this propagation we find constant offsets between various reservoirs of carbon, such as teeth of herbivores, soil carbon, plants, and the oceans.
Offsets between carbon isotope values in various parts of the biosphere; for this figure all plant life is assumed to be C3.
