heavy and light rain
Why would we study isotopes?
The study of the isotopic composition of various compounds is a very powerful way to trace the history of molecules: who has eaten it? from what water was it precipitated?
Introduction
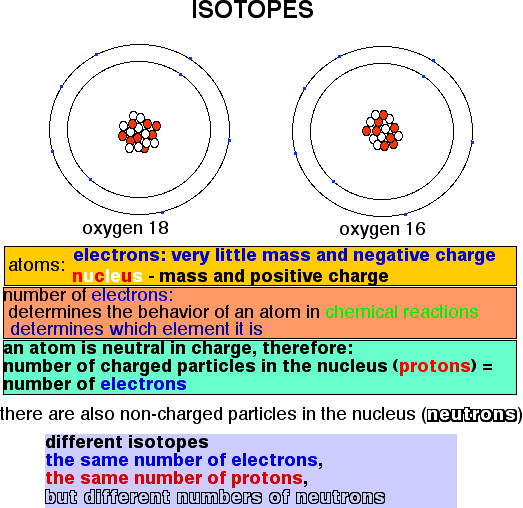
Atoms of all matter on Earth are made up (if we do not go into too much detail) of a nucleus and electrons. The nucleus has a positive charge and most of the mass of the atom; electrons circle the nucleus, have very little mass and a negative charge, The overall charge of an atom is neutral, because the number of positive particles in the nucleus (protons) equals the number of electrons. The number of electrons determines to which element an atom belongs, and how it behaves in chemical reactions. In addition to protons, the nucleus of all elements may contain particles with the same mass as a proton, but uncharged; these are called neutrons. The number of protons plus neutrons is called the atomic mass number.
Atoms with the same number of electrons and protons, but different numbers of neutrons, are called isotopes. Different isotopes belong to the same element because they have the same number of electrons, which means that they all behave almost the same in chemical reactions. It was discovered during the Second World War that isotopes of the same element can be separated by physical and chemical methods. This discovery provided the basis for the methods of enrichment of the fissionable isotope of Uranium (235U, meaning that the sum of the number of protons and neutrons is 235), and ultimately the atomic bomb.
The isotopes that we will discuss here are the isotopes of the two
elements that occur in water, hydrogen and oxygen. Hydrogen occurs as
two isotopes. The most common hydrogen isotope has only one proton in
its nucleus (1H), but an isotope with 1 proton and 1
neutron also occurs. This isotope is called Deuterium
(2D). A hydrogen isotope with 1 proton and 2 neutrons is
not stable but radioactive, is called Tritium (3T) and
used in the manufacturing of nuclear bombs.
Oxygen occurs in nature as 3 different isotopes, each with 8
protons. The most common isotope is 16O (8 protons, 8
neutrons), which constitutes 99.765% of all oxygen atoms on earth.
There is also the rare isotope 18O (0.1995%) and the even
rarer isotope 17O. The most common water molecule by far
has the most common isotopes of hydrogen and oxygen ans is thus
1H216O, but there are also
such molecules as H218O, and
HD16O. Molecules with more than one rare, heavy
isotope are really rare.

Isotope fractionation this is a partial separation of isotopes of the same element during physical (e.g., evaporation) or chemical (e.g., precipitation) processes.
Why does this separation occur?
Differences in physico-chemical properties of molecules with different isotopes, because different isotopes of the same element have a different mass. There are two different types of processes of isotope fractionation:
The amount of fractionation tells us which reactions an atom in a molecule has gone through.
Molecules with different isotopes of a particular element have different bonding characteristics: the bonds between the atoms are just a bit different because the atoms have different masses. As a result, the molecules with different isotopes behave a little bit different during chemical reactions, as well as during such physical processes as evaporation and condensation. Note that during a chemical reaction atoms have to change partners and become linked to other atoms, whereas during physical processes the state (gas, liquid, solid) changes. The bonds holding the lighter isotope within the molecules break a bit easier than the bonds holding the heavy isotope. The amount of the difference varies with temperature, is largest at lower temperatures and disappears at high temperatures. Such difference in behavior as a result of the different bonding properties is called equilibrium isotope fractionation. How much fractionation occurs depends on the temperature, as well as on the specific atoms involved. The largest differences in behavior occur for isotopes that have the largest relative difference in mass. There is much more fractionation between hydrogen and deuterium (one of which is twice as heavy than the other), than we see in oxygen, where the difference in mass is only (18-16)/16 = 1/8.
The effects of differences in strength of chemical bonds are not the only ones. In a gas, the molecule holding the lighter isotope moves a bit faster than the molecule holding the heavier isotope. Difference in behavior resulting from the differences in speed with which molecules holding different isotopes move are called kinetic isotope fractionation.
We measure concentrations of isotopes of a
specific element in equipment called mass spectrometers, which
separate gas molecules according to their mass. The rare
(usually heavier) isotope is so rare that its concentration is
difficult to measure precisely. We therefore do not measure the
concentration of the isotope directly, but we compare the
concentration of the isotope in a sample and in a standard material.
The results of such comparison-measurements are given in what we call
the delta (d)
notation
(d
for difference in measurement between
standard and sample). This results in positive delta values if the
sample has more of the heavy isotope than the standard, negative
delta values if the sample has less of the heavy isotopes than the
standard. For many elements the delta values for the isotopic
composition are given in per mille (‰), parts per
thousands, rather than in per cent (%). For hydrogen and oxygen
in water, the standard used is most commonly standard mean ocean
water (SMOW), an average value for the isotopic composition of ocean
water.
Why would that be
of interest?
In nature, isotope fractionation occurs during chemical reactions such as the precipitation of calcite and physical processes such as evaporation and condensation. We can measure isotope ratios in various compounds and then use the information to trace the history of specific molecules. With water, for instance, the isotopic composition tells us where it came from and what happened to it on its way there.
Most water vapor on earth is produced by evaporation in the tropics: that is where it is warmest (lots of evaporation), and because of the spherical shape of the earth there is a very large surface area at low latitudes. Much of this water vapor rains out again close to the equator (it's not called tropical rain forest for nothing). But if we look at net transport of water vapor, we see that rain and snow at high latitudes is (on a global scale) transported there from the low latitudes (transporting heat along the way &endash; latent heat transport). Only a very small fraction of the total water vapor makes it to the poles.
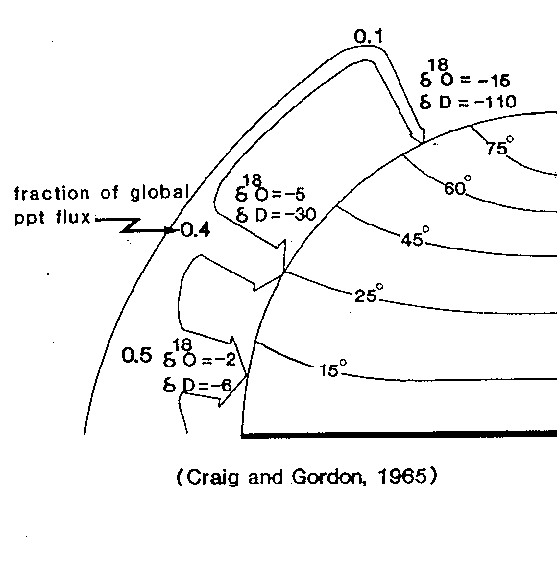
When water evaporates, the water vapor becomes enriched in the molecules carrying the lighter isotope as compared to the water it leaves behind. When water vapor condenses into water, it becomes enriched in molecules carrying the heavier isotope as compared to the vapor it leaves behind. We can see the whole earth as a gigantic multiple-stage distillation column for water (and ice), with so-called 'reflux of the condensate to the reservoir'. Such a process of multiple stage distillation is called Rayleigh fractionation. The ocean is the reservoir, the rain at different latitudes is the condensate at different stages. The polar ice caps are formed from snow from the very small percentage of water vapor that has traveled furthest from its origin at the poles, and can be seen as the highest stage in the evaporation column. During all the steps of evaporation and condensation isotope fractionation occurs.
It goes as follows: water evaporates at the equator, and the water vapor is isotopically lighter (in hydrogen as well as oxygen) than the ocean water which remains behind. The water vapor then travels towards one of the poles. During this travel some of the vapor condenses. This condensed water is isotopically heavier than the water vapor it leaves behind (up in the clouds). But because the removed water is isotopically heavier than the vapor which remains up in the air, this remaining vapor has even less of water molecules with the heavy isotope, and is thus isotopically even lighter than the water vapor was before. At every latitude more rain falls out of the clouds, and the remaining water vapor loses more and more of its molecules with heavy isotopes. The water that is isotopically the lightest on Earth thus falls as snow at the poles.
Figure 1: Rayleigh fractionation on Earth. 'Fraction of global ppt flux' means 'fraction of global precipitation flux'. The quarter sphere is representing the globe).

At mid and high latitudes we see a correlation between the temperature of the rain or snow and the isotopic composition. This correlation, where low temperatures correlate with a light isotopic composition (as compared to SMOW) is for the largest part determined by the Rayleigh fractionation processes described above, not directly by the temperature itself. First, water vapor that reaches the highest latitudes, where it is on average colder, has traveled furthest from the poles and thus has been through many steps of losing rain and more rain. During these steps of losing more rain, it has steadily become more depleted in the heavy isotopes which preferentially go out of the clouds into the rain. Second, when the air is coldest, it holds the least vapor, and thus has been depleted of most of its water. But water vapor in a parcel of air that has lost almost all its water has also lost almost all of its heavier isotopes, and becomes isotopically extremely light. Third, we see the lowest temperatures in the interior of the polar ice caps, where the water vapor travelling from the oceans inland has lost additional snow when the clouds move upwards over mountain ranges. And fourth, remember that the difference between the isotopic ratio in rain and the remaining water vapor is larger at lower temperatures (see introduction).
There are additional effects on the hydrogen and oxygen isotopic fractionation in polar ice that do result from the direct effect of the temperature: there is kinetic fractionation of oxygen and hydrogen within growing ice crystals - how fast the water molecules containing different isotopes move into the crystal. These effects, however, are much smaller than the effects of Rayleigh fractionation described above, they are well known and they are corrected for in the equations deriving temperature from oxygen or hydrogen isotopic composition of polar ice.
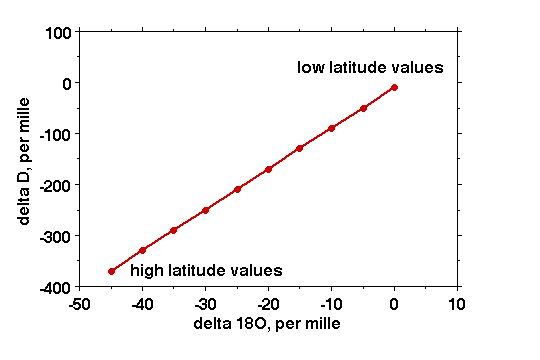
This correlation between temperature and isotopic composition of both hydrogen and oxygen has been studied intensively, and empirically observed many times. All waters on the earth which have participated in evaporation and condensation (thus with the exception of such waters as these coming out of volcanoes) have different isotopic ratios of hydrogen to deuterium and of 16O to 18O. But in the processes of evaporation and condensation both hydrogen and oxygen isotopic composition changes and the ratio of the hydrogen to oxygen isotope ratios remains constant. The isotopic composition of hydrogen to oxygen of all natural waters thus falls on a straight line, called the meteoric water line. In formula: dD = 8 d18O + 10.

We can thus easily predict what the hydrogen isotopic composition of ice is if we know its oxygen isotopic composition, and the reverse, and both can be used to estimate the temperature of polar ice.
Notice that the exact isotopic composition of polar ice depends on the travel path of air with water vapor from equator to poles. If these pathways were different in the past (e.g., during ice ages), the relation between temperature and isotopic composition of ice was different than it is today, which give uncertainty in temperature estimates.
The additional methods of temperature estimates
(nitrogen isotopes, direct temperature measurements in the ice cap)
as described in the paper by Taylor (1999) have helped us to realize
that the temperature differences in Greenland between the last
glacial maximum and today was larger (about 15oC or so)
than had been estimated from isotopic measurements. These differences
were most probably caused by different pathways of the moving air,
i.e., winds, during ice ages.
The nitrogen isotope
method works like this: N2
(dinitrogen gas), the most common gas in the atmosphere,
occurs as the stable isotope 14N (the most abundant
isotope) and the much rarer, heavier isotope 15N. It is
know from laboratory experiments that a gas (consisting of molecules
with different isotopes) that is present in a space where one side is
colder than the other side will undergo a process called
thermal
diffusion. During this process the
molecules with the heavier isotope will tend to move preferentially
to the cooler site, and the molecules with the lighter isotope
towards the warmer side; this is an example of kinetic isotope
fractionation. The larger the temperature difference, the greater
the separation of olecules with heavier and lighter isotopes.
The upper part of ice in polar ice caps is still full of pore spaces to the atmosphere, and nitrogen gas circulates through these open spaces. If there is a change in climate, let's say warming, going on at the place where the ice sheet is (for examples from -30oC to -20oC, so the ice is not melting), the heavier nitrogen isotopes will wander to the coldest place in the ice where they can go. In this example the deepest part of the ice where the nitrogen molecules can penetrate is the coldest: this deeper part of the ice is still very cold because it has not been warmed up by the warmer atmosphere above it. Over time, the air bubbles with the heavy isotope are locked in when the ice closes around the bubbles. The effect is, that during a period of climatic warming an ice layer forms that contains bubbles enriched in the heavy isotope of nitrogen. During a cooling event, when the air above the ice cools, the heavier isotopes of nitrogen move out of the ice, and a layer develops with air bubbles depleted in the heavy isotope of nitrogen.
This method was first published by J. P. Severinghaus, T. Sowers, E. J. Brook, R. B. Alley, and M. L. Bender, 1998, Timing of abrupt climate change at the end of the Younger Dryas interval from thermally fractionated gases in polar ice. Nature, vol. 391, p. 141-146.
The frozen turkey
model of measuring temperatures in the ice
sheet works as follows; the basic premise is that a deep frozen
turkey does not easily change its temperature even if it is placed in
warm air. The same is valid for ice: it does not warm easily if the
temperature changes from 25 to 15 degrees below zero (as long as it
does not get so warm that it melts).
After drilling a hole in the ice and taking out a core, you place thermometers in the drilled hole. You wait until the temperature changes resulting from the drilling action have disappeared, and you measure the temperature at many places in a deep hole in the ice sheet. The temperature is higher in the lowermost part of the ice sheet, where it is in contact with rocks which are warmer than ice and have a temperature of about minus 10 to minus 14 oC. The temperatures in this part of the ice sheet tell you something about how the ice sheet moves over the rocks, and how cold or warm the rocks are.
Several hundreds of meters above the contact of ice and rock, in contrast, the temperature of the ice tells you about the history of temperatures that the large pile of ice has lived through. The snow falls through the atmosphere and gets the same temperature as the atmosphere. The snow then becomes ice, and still keeps that same temperature. If it becomes somewhat warmer, the snow falling during this warmer climate reflects a higher temperature than the existing ice had. This new snow keeps the somewhat warmer temperature of the air that it feel through when it accumulates as ice. We thus see a piling up of ice layers that each have a slightly different temperature (all below freezing or we do not have ice left), reflecting the average temperature of the air through which the snow fell. Ice and water do not exchange heat easily, so these temperature differences persist in the ice. There are exchanges of heat and many complexities, and this method requires mathematically complex modeling of ice temperatures.
This method was first published by D. Dahl-Jensen, K. Mosegaard, N. Gundestrup, G. D. Clow, S. J. Johnson, A. W. Hansen, and N. Balling, 1998. Past Temperatures directly from the Greenland Ice Sheet. Science, vol. 282, p. 268-271.